This audiovisual installation explores the meteorological data of the Douro Demarcated Region, from 2007 to the present day, and aims to contribute to a greater awareness of the environ- mental changes to which this region is subject to.
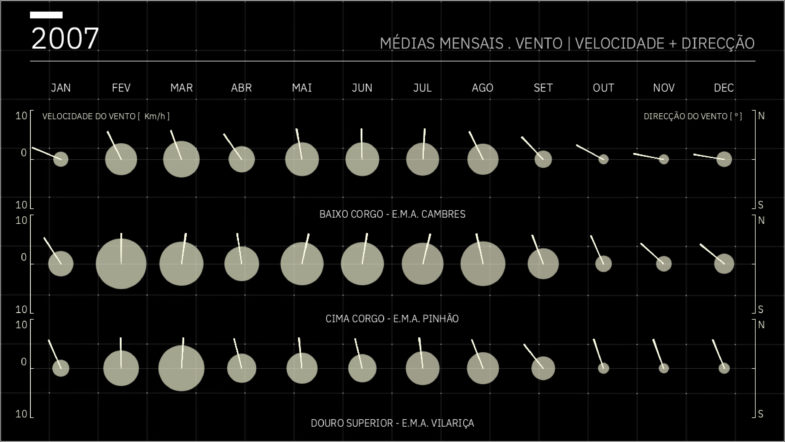
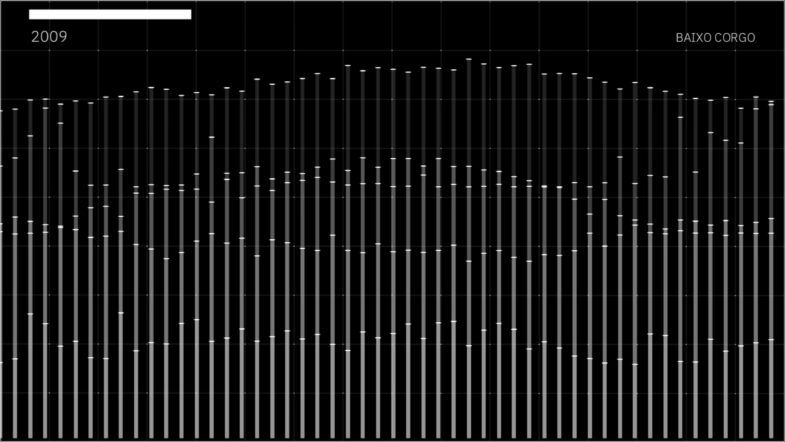
In the video on display, the meteorological data (temperature, humidity, radiation, rainfall, wind speed and direction) collected in the three areas of the Douro Demarcated Region is analysed and compared. It also presents a comparative analysis between the Vintage years of 2007, 2011, 2016 and 2017.
This project was developed and presented at the “Douro & Porto – Memory With a Future” Congress (November 2020), promoted by IVDP (Instituto de Vinhos do Douro e Porto). The installation was presented at Museu do Douro (Peso da Régua).
_
Design and Development: Rodrigo Carvalho e Ana Duarte
Sound: André Sousa
Promoted by IVDP (Instituto de Vinhos do Douro e Porto);
Project Management by EMERGENCE (Gustavo Magalhães & Tiago Rocha);
Partners: Museu do Douro & ADVID (Associação para o Desenvolvimento da Viticultura Duriense).

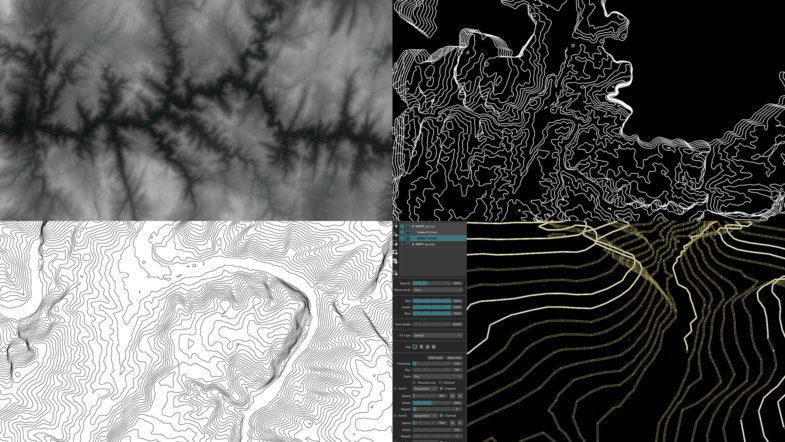
The contour/topographic 3d visualisation scene represents real locations from the Douro Valley. It was made based on an old Processing tutorial by Onformative. While looking for an approach for visualize the topography map in 3D, we found this Processing Forum’s post from 2011. The link on the forum does not work anymore, but can be accessible via WayBack Machine.
It was used an heightmap image from the Douro region, taken from the elevation data browser tangrams.github.io
On Processing the heightmap was used as a displacement map to generate the topographic-lines 3D visualisation. Then a set of camera perspective views were chosen and the image was exported from Processing as PDF vector lines. Theses were later clean up and exported (on illustrator) as SVG.
Finally SVG files were imported on Madmapper and animated on real time with Line tools .

[DouroValley HeightMap / 3D on P5 / SVG vectorline / Animating Lines on Madmapper]

[Installation at Museo do Douro]


